#267: Regression? It Can be Extraordinary! (OLS FTW. IYKYK.) with Chelsea Parlett-Pelleriti

Why? Or… y? What is y? Why, it’s mx + b! It’s the formula for a line, which is just a hop, a skip, and an error term away from the formula for a linear regression! On the one hand, it couldn’t be simpler. On the other hand, it’s a broad and deep topic. You’ve got your parameters, your feature engineering, your regularization, the risks of flawed assumptions and multicollinearity and overfitting, the distinction between inference and prediction… and that’s just a warm-up! What variables would you expect to be significant in a model aimed at predicting how engaging an episode will be? Presumably, guest quality would top your list! It topped ours, which is why we asked past guest Chelsea Parlett-Pelleriti from Recast to return for an exploration of the topic! Our model crushed it.
The image that Moe referenced in the show:
Items of Interest Mentioned in the Show
- (YouTube Channel) Ritvikmath
- The Recast Blog
- (Article) Unfair but Valid Feedback; a Seeming Contradiction by Deb Liu
- Save This Life pet microchipping company shuts down (Save This Life chips start with either 991 or 900164)
- ^^^ Re-registering can be done at Free Pet Chip Registry
Photo by Nick Baker on Unsplash
Episode Transcript
0:00:05.8 Announcer: Welcome to the Analytics Power Hour. Analytics topics covered conversationally and sometimes with explicit language.
0:00:18.0 Tim Wilson: Hi, everyone. Welcome to the Analytics Power Hour. This is episode number 267. I’m Tim Wilson from Facts & Feelings, and according to the logistic regression that I ran personally on the last 40 episodes of this show, there is a 72.3% chance that I’m joined for this episode by Julie Hoyer from Further. Julie, is that you?
0:00:39.2 Julie Hoyer: Hey, look at that. Yes, it is. Here I am.
0:00:42.2 TW: Look at my model kicking ass. Sweet. So it also says there’s a 61.4% chance that Michael Helbling from Stacked analytics will be another co-host. Michael? Michael. Michael. Okay. No Michael. Let’s see. Next up, the model said there was a 41.7% chance that Moe Kiss from Canva would be co-hosting. Moe, are you there?
0:01:09.2 Moe Kiss: I am. But is your model any good?
0:01:13.0 TW: Well, I plugged in everything I had and when I created the regression, but it still couldn’t perfectly predict who would be co-hosting. Does that mean my model was wrong? Did a model even really exist? Well, maybe the answer is I don’t think so for either one. But I have questions. And when we have questions and we have a podcast, we get to find someone to answer them. In this case, we reached back into our archives for one of our favorite past guests. Chelsea Parlett-Pelleriti, also known as the Chartistician, is a statistician and data scientist who was our guest way back on episode number 149. By day, she is a consulting statistician with our friends at Recast, but she also has a passion for teaching, bringing interest and excitement about math and statistics to the masses in fun and engaging and even endearing ways. She has a PhD in Computational and data sciences, which the last time she was on, she was still working towards. So she has since completed that and she was an assistant professor at Chapman University up until last year, teaching computer science, data science, and machine learning, which made for some pretty awesome social media content.
0:02:24.5 TW: She’s still keeping her foot in teaching. She’s actually currently teaching a math through video games seminar as an adjunct professor. And she just likes teaching stuff. And maybe I botched my intro. I was doing so well. But today she is our guest. Welcome back to the show, Chelsea.
0:02:43.7 Chelsea Parlett-Pelleriti: Thank you. It is a pleasure to be here. But it makes me feel very old thinking how long ago it was that I was last on the show.
0:02:52.7 TW: Okay. Well…
0:02:54.3 CP: So now you’re making me feel super, super Old.
0:02:56.3 TW: Yeah, I believe you’re right. I was in my 40s, and that was a long time ago.
0:03:04.0 CP: I was in my 20s.
0:03:05.7 TW: Oh, okay. Okay. Well, the passage of time. So this show is… It’s actually a direct result of the listener survey we did last year, which we had a bonus episode that came out a little while back that talked about that. And we had multiple respondents who requested in one way or another that we cover specific statistical methods on the show. And this is really kind of our first attempt at doing that. So we’ll see how it goes. I’m not ashamed to say I got pretty excited as I was thinking about this show because I realized how much I’ve been faking various things for a while. And this is my opportunity to ask questions as though I know the answer when I don’t. And then I will know.
0:03:50.1 CP: And I can ask the questions like, I don’t know the answer when I really don’t know the answer.
0:03:54.0 TW: That’s good.
0:03:55.4 CP: Good compliment.
0:03:56.7 TW: And Julie will be the only one who understands the answers. So there we go. We’ve got the full. The full set.
0:04:01.7 JH: It’ll be a refresh for me, too. I don’t get to do as many regressions in my day-to-day as I would like.
0:04:07.5 TW: Well, what seemed like a great place to start would be with that kind of absolute workhorse of prediction, which is plain old regression. And Chelsea, you’re pretty deep and if I understand all the content I read from Recast pretty well, then you’re pretty deep in the world of kind of Bayesian statistics and causal inference when it comes to doing media mixed modeling work. So does regression come up in your day-to-day at all? Or is that too basic? You’ve moved on to fancier things?
0:04:40.9 CP: I mean, there’s definitely a time and place for fancier methods. But linear regression is probably the first thing I try in any problem that it might be a good fit for and definitely has a place in my day-to-day still. And I think there’s a sense in which you can think even really complicated MMM Models like you can build with Recast or other tools. There’s a sense in which it’s just an extension of ideas that are present in linear regression. So even if you’re not actually using a linear regression, you’re really capitalizing on the ideas that using linear regression teaches you. So in that sense, it never goes away.
0:05:18.5 TW: That checks. I feel like I’ve watched my… I’ll count myself as one of the people who, when they finally understood kind of what MMM was and then decided to try to explain it. You always wind up with the slide that shows the formula for regression and says, look, so your dependent variable is. And your independent variable. And the coefficients mean. So you’re saying that is a… Even Kevin Hartman has a video on the basics of regression. And I think he uses, basically, he didn’t say mixed modeling, but he uses that as an example. Okay, that’s good to know. So should we define regression and we’ll see where it goes from there? Like, if you’re… Did you have to do that with students say, here’s Regression Intro 101. How would you explain it?
0:06:11.1 CP: Yeah, absolutely. I mean, if we’re just talking about linear regression, it’s basically a model that you can look at both predictably, so trying to actually make predictions with it, or inferentially trying to understand the relationship between variables. And it’s a super simple model because all it is is that equation for a line that you learned back in, I don’t know, middle school or whenever that came up for you in the math curriculum, where it’s y=mx+b. Right? That’s the definition of an equation of a line. And that’s exactly what linear regression is. It uses various variables in order to predict something that you’re interested in, whether it’s revenue or conversions or something like that. By combining the predictors that you have in a linear way, all that means is that every single predictor variable you have, you’re going to multiply it by a number, add all of those together, and that’s going to be the prediction of your model.
0:07:09.9 MK: Can we go back to when you said it’s still such a big part of your day for problems where it’s appropriate? When you are sitting at your desk doing your work, what are the problems that you’re like, no, I’m definitely not trying that first.
0:07:24.8 CP: That’s a really good question. I think it depends a bit on what tools you have available. My way of working is that anytime a problem comes up, I want to try the simplest method possible to solve that problem. So if it’s a problem where perhaps just a graph is going to solve the problem and answer my question, I wouldn’t go as far as linear regression to answer that question. And on the flip side, if I have a problem that is super complicated and I know, for instance, it’s going to violate some of the assumptions of linear regression, then I might skip over it just because I know that any answer that I get out of it might not actually be usable and I don’t want to invest my time there. For instance, if we have a really complicated problem, for instance, in marketing, one of the things that we talk about a lot is that we have not a problem. We have an interesting scenario where when we spend money it doesn’t have an effect right away all the time. Sometimes it takes a while for that spend to actually have an impact in your market.
0:08:30.8 CP: And that might be something that’s kind of hard to represent with a linear regression. You may at that point need to graduate to more complicated models. So it’s say if I already know that something simpler is going to work or I know for sure that my problem just doesn’t fit the parameters of a linear regression. Those are the times when I would say, eh, I’m not even going to try. But pretty much any other time I want to try it because it’s a super interpretable model, it’s super easy to run compared to other options and most people have a little bit of knowledge about what a linear regression is. So it’s really easy to communicate results even to non technical stakeholders.
0:09:10.5 TW: So I feel like you skipped. I mean you kind of briefly hit it as to whether or not it wouldn’t be a fit. Like using the Y=mX+B. Like you have to have a Y and that Y has to be singular. So if somebody said, can you look at this data and kind of put them into logical groups? Like then where you don’t have a, like you need to kind of have a dependent variable and one or more like the framing of the problem needs to kind of lend itself to saying I’m trying to find a relationship between one or more of these things in this other singular thing. Right. Like that’s kind of the first deal.
0:09:44.6 CP: Yeah, well you can always, yeah, you could always have like a multivariate regression where you have, you’re actually predicting a vector of values but in its most simple form, exactly. And one of the things you mentioned kind of made me think about. Yeah, it’s, it’s really only for supervised questions. Supervised in the machine learning world, meaning we already know the answer for some set subset of our data that we can train on. So for instance, if you’re doing customer segmentation, that’s an example of something where you don’t have a correct answer. We don’t know what these latent groups are that are in our customer data. And so we can’t use something, even a modified version of Linear regression, because that’s an unsupervised problem. We don’t have the answer in order to train our model. So that’s an example of where linear regression, or any extension of it, wouldn’t be a good fit.
0:10:37.1 JH: And you also mentioned assumptions where you said, I have to make sure that no assumptions around a linear regression would be broken. And then I say, yes, it’s a good fit to use. Can we talk a little bit about those? Like, obviously you just said supervised, but what are some of the other ones?
0:10:52.6 CP: Yeah, there’s a ton of them. Some of them have really funny names, so I’ll give you a little bit of a warning before we get there. But one of the most important ones is something that sounds so silly, but is the assumption that the relationship between our variables and our outcome is linear in the parameters. So what that means is whatever columns of your data that you’re going to plug in as predictors into your model, the relationship between them and your outcome has to be linear and additive, meaning that as your predictor variable increases, there’s some type of constant relationship between that increase and the increase in the predicted outcome that you’re trying to predict. So, for instance, if you’re trying to predict how much revenue am I going to get depending on how much I spend in Facebook? In a linear regression model, your coefficient says no matter how much I spend, every increased dollar that I spend in Facebook is going to increase my predicted revenue the exact same amount, not maybe the most good assumption. In a lot of cases, an additive basically means that all of the impacts that my different predictor variables are going to have, they’re kind of independent, and we’re adding them all together at the end.
0:12:12.2 CP: And that’s just reflected in that Y=mX+B formula, right? Every single predictor is getting multiplied by a constant coefficient. And then we’re adding up all of those effects to together to get our predicted outcome.
0:12:24.6 TW: But that doesn’t mean the predictors can’t be squared or cubed or combined across multiple interaction effects, or basically taking X1 and an X2 and multiplying them together.
0:12:36.1 CP: Exactly.
0:12:36.9 MK: Okay, okay, now you’ve got to go a bit slower. You got to go a bit slower on that one. You lost me.
0:12:41.6 CP: Okay, that’s linear in the parameters, right? The parameters of your regression model are the intercept and a coefficient or multiple coefficients. So when we say linear in the parameters, all we mean is that whatever it is that our predictors are, we’re multiplying them by a constant adding them together, but exactly as you said. So say you think that there isn’t a perfectly linear relationship between… We’ll stick with the example of Facebook spend and revenue. One of the things that we could do is I like to call just feature engineering. We could take the amount we’re spending in Facebook and we could add a new column that is the amount we spent in Facebook squared. And so now we have two predictors. We have how much we spent in Facebook, how much we spent in Facebook squared. But that still fits into the mindset of linear regression because the actual columns you’re plugging into your model still linear in the parameters. Our Facebook spend squared is just a new predictor that we are assigning a coefficient, multiplying it by that constant coefficient, adding it to our prediction. And the same happens for interaction. So interaction terms are just the value of two or more predictors multiplied together.
0:13:57.8 CP: And again, it’s just feature engineering. You’re creating a new column to put into your regression model and that allows you to understand the relationship of when these two things co-occur together. How am I adjusting my expectation or my prediction based on the fact that they’re occurring together? And I think they have some type of relationship.
0:14:20.3 TW: So there are a couple ways. The feature engineering thing is kind of a fascinating. And I have, I think, two questions. One choosing the features feels like there’s a lot of kind of art in that. But there’s also, as I understand it, there’s a risk that if you, if you chose two features that are strongly, strongly correlated with each other, it could cause problems. And why am I now blanking on what that is?
0:14:52.7 MK: Multicollinearity.
0:14:54.3 TW: Multicollinearity. And it was there. I was like, yeah, it’s there.
0:14:58.0 MK: Yeah totally there. I was the tip of my tongue.
0:15:00.3 TW: It was. But I guess so that’s because if we look at it and say, I’ll just throw it at the data, but the data is just going to have X, it’s not going to have X squared. It’s not going to have the square root of X. It’s not going to have x1 meets x2. What’s kind of the approach and what are the risks if you try to get too fancy with that?
0:15:24.2 CP: Well, one of the risks is that you’ll be just too fancy and no one will want to talk to you. But the major risk there is that you’re going to be misspecifying your model and/or you’re going to be overfitting your model. So this is a super common thing. If you’re not really thinking through what it is that you want to include in your model. And let me give you an example. So let’s say that I am fitting. We call… So when we add X squared, X cubed, blah blah blah to the predictors of our model, we usually call that polynomial regression. And if you have a polynomial of 75 degrees, I don’t know if that means anything to you, but what that means is that the line that you can fit to your data is incredibly wiggly. It can literally hit every single point, probably, or a lot of the points in your data set. And that’s going to lead to overfitting. So one of the risks that you take when you do things like this feature engineering is that you might be overfitting. Now, there’s ways around that. I don’t know if you want to get into things like regularization which can help you understand, or like pull back the impact of terms that are…
0:16:35.2 TW: Is that where K-fold cross-validation would fit in. No, damn it.
0:16:40.4 CP: Not quite. Okay. Very related though. Yeah. Too soon. I think you’re jumping the gun a little bit. Okay, but, but the other point I wanted to make there, so you have tools like regularization, I’ll give you… So the real world way to define regularization is it’s any method that makes your model a little bit simpler. In the practice of regularizing coefficient estimates, usually what that means is pulling them closer to zero, unless there’s evidence that having a non zero coefficient really improves the fit of your model. So if you’re familiar out there with lasso or ridge regression, that’s what they’re doing. Those are methods of regularization that basically encode the idea that in the real world most effects are exactly zero or close to zero, unless we have pretty strong evidence to the contrary. So that’s one thing you can do. But my favorite way of approaching this is always leveraging the subject matter expertise that we have. I have a really technical background, but I can’t build good models unless I understand the context of what we’re building and what we’re building for. And so honestly, my favorite way to approach this is often to get the opinion of subject matter experts who are able to give insight, at least to some degree about what we should include.
0:18:00.5 CP: For instance, we are talking about interaction terms which basically says when two predictors co-occur together, how does that change our prediction? A lot of times subject matter experts will have a good idea about which ones should be included in the model and which ones are just so ridiculous, we would never even want to try them. So while there are statistical techniques to handle the risks there, my favorite way is with, if it’s available expertise.
0:18:27.0 MK: How do you go selling that to especially, like clients and whatnot? Because I feel like sometimes they think it’s like disconnected. Like you go away and build the best model and sometimes convincing them that you need the business context or I guess, guidance on assumptions. I don’t know, I feel like there could be resistance or that there could be pushback, that they’re bringing bias in. Like, what’s your take on that?
0:18:53.3 CP: Oh, my gosh, that is a huge concern. Especially I work a lot with Bayesian models. So you not only have kind of this prior information coming through the settings you’re choosing of your model, what type of model you run, but also through the priors that enter into the analysis. And I think the way that I talk about it has to do with leveraging different sources of data. Right. So we actually have your data, the data that we’re going to use to train your model to fit your model. But we also have sources of information that come through your years or decades of expertise. One of the examples I liked to give in my classes, even before I was in the marketing space, is that if I’m doing an experiment and I’m looking at the click rate of an email that I’m going to send out, maybe I’m like A/B testing it. It would be silly of me if I didn’t leverage the expertise of the marketing people in the room who know that click rates are probably going to be, I’m making this number up around 2%. It would be insane if I got an 80% click, like something went wrong there if I got an 80% click rate.
0:20:01.3 CP: And while I understand the desire to not bias your model, and certainly that can be a concern, it really feels like throwing away information to not include that expertise in your analysis where appropriate. So through a Bayesian prior or through some model setting configurations, another thing that comes up especially with MMM, these are such complicated models. Not always. I think Tim might have a story about not the most complicated MMM model, but basically these are often really complicated models and there just isn’t enough data for us to get really good estimates on the parameters that we would like to know in your model. And so we need that prior information in order to fit a model that makes sense. Right. If you tell us, hey, ROIs are certainly not going to be 200, that’s really helpful to the model. And I don’t think that’s biasing. But at the same time, we do caution people a lot to make sure that they’re not overly specifying the prior information in a way that tells the model exactly what to say. We still want the data to have a say in what the model is learning. But it would be silly to assume that you don’t have expertise from years and years in the marketing space that can help us inform our analyses.
0:21:20.1 CP: But I will say there is a lot of pushback. And often what it comes down to is we’ll put very loose parameters of say, okay, if you really don’t know, here’s different things that you can try and we’ll show them. When you have information that’s reasonable, it actually improves the insights you can make. And that really happened to me a lot when I was a professor. We would often do a lot of consulting with people who weren’t super familiar with Bayesian models, for example, and there was so much pushback about I don’t know what a prior should be. Shouldn’t the data tell me what the prior should be? And what I usually like to tell them, at least in the psychology space, which was primarily where I was working, is, okay, if I told you that this intervention that you’re testing had an impact where it improved people’s IQ by 70 points, what would you come back and tell me? And most of the time they would say, that’s insane. You did something wrong. And I say, that’s prior information, even if it’s very loose. You’re giving us a little bit of an idea of what a reasonable value to expect would be. And that can be super helpful in an analysis.
0:22:29.6 MK: Tim, I’m drawing so many parallels right now between this and when you talk about bracketing for setting targets. What’s your reaction to that?
0:22:39.4 TW: Yeah. I mean, I was thinking the same thing. Like, I will frame. I mean, the same thing. Running into setting targets for KPIs, and people say, what are you talking about? Like, I have no idea. And then you say, well, what if your KPI is to give them this drug or this intervention and increase their IQ by 70 points? And they’d be like, well, no, like there’s no way it’s going to do that. I’m like, oh, well, I guess you do have some expectations. But I had not made the link to using that for as priors to go into a Bayesian. That’s wild. Does it work, if you’ve got, say, two parties, they’re both subject matter experts, and one, we’ll just go back to Facebook and say, one says, I think Facebook is definitely heavy is driving sales. And the other person says, I don’t think Facebook is doing anything. Is that still useful to say? Yeah, we’ll plug it in to… We’ll include it in the model. And then. And then the model can, with caveats, come back and say, yeah, it looks like there is a detective now whether it’s actually Facebook or something. Confounding separate discussion. But is that still useful? It’s like this could be at play included in the model, and then see if it’s detectable.
0:24:05.3 CP: Yeah, I mean, in cases like that, where there’s not a lot of overlap in the subject matter experts opinions, you have a couple ways that you can approach this. One thing that I would do before I even ran a model, though, is ask them why they think that is their internal data. What is the assumption that they’re making that made them come to that conclusion? Because I would be super shocked if two people with access to the same information, with the same assumptions came to such different conclusions. We never want to include vibes as priors. We want to have kind of informed decisions and reasons why we believe this stuff. And so that would be my first line of defense, because I think once you uncovered that, you’d figure out that they’re making really different assumptions, they’re applying it in really different contexts, and that’s why they’re coming to different answers. But if magically that was the case, that they really had the same information and they were just coming to very different conclusions, I think one of the things that you could do is you could have a very wide prior. Right.
0:25:12.7 CP: When you take the collective expertise of the different experts, then there does seem to be a lot of uncertainty. And one of the things that you said that was interesting is you’re kind of talking about the point estimate of what they expect in terms of, let’s say, an ROI. One thinks it’s really low, one thinks it’s really high. But when you extract information that might be useful in an analysis as a prior, you really have to make sure that you’re also thinking about uncertainty. So maybe if you ask them for uncertainty around their estimates, you would find a lot more overlap in what they believe and it might be easier to translate. That being said, if they don’t and they can’t agree, then I might do something called a sensitivity analysis where I ran the model with expert one’s priors and ran the model with expert two’s priors and then saw how the model performs. Right. If your model can’t form forecast well, if it has high variance, it’s adjusting all the time and giving you different insights. That’s a bad model. And if one of the priors lends itself more to that poor performance, probably not a good prior, or maybe there’s something misspecified in our model. But I would test something like that and just see like, does it negatively impact the insights we’re getting from the analysis?
0:26:23.7 JH: Can I take us back a little bit? When you talked about using regression for prediction or like inferentially, because when you’re talking about like this feature engineering, do you have to go about it differently when you are using it to create a model to predict something? Right. Compared to like you’re trying to inference something? Because I think I’ve used regressions more. So when I’m looking at historical data, we have a business question they’re asking and we’re trying to infer if a relationship exists. And I feel like that I’ve always read things and had the experience talking to colleagues where you have to be really careful about not looking at the results and then tweaking. Right. You don’t want to like bring in bias of your features to make it look good at the end. And so we always had these discussions about choosing your features and doing a lot of other work to determine what relationships you need to represent or not before running it and kind of being like that’s the answer. Whereas it sounds like though when you’re using it for prediction, you’re trying to find the model that has the best fit on what you’re training it on so then you can use it moving forward with high confidence, higher confidence. Right. But can you, am I misinformed there? Like, do you do feature engineering differently for those two scenarios?
0:27:40.1 CP: Yeah, that’s a great question. I think in general, because your goals are so different, right. With prediction, all you care about is that the output of the model, the thing that it’s predicting is as close to what the real value is in the real world. Whereas when you’re doing inference, what you care most about is, are the parameters of your model, say your regression coefficients, are those accurate to the real life relationships? And often that kind of veers into causal inference territory as well. But basically I would say you would approach it differently, there’s a lot of overlap. But for instance, in the predictive space, yeah, we might have a little more freedom to play with our model and try and get the best prediction, but we have to be really still careful about overfitting to the sample of data that we have. Which is to Tim’s earlier point, why we do things like cross-validation or any type of model validation that basically says if we hold out some data from being used to fit the model, can the model still make good predictions? Because if it can’t, then it means that we’ve probably done what you were describing, which is we’ve kind of over engineered our model to fit fit too specifically to the sample of data that we have.
0:28:50.2 CP: And it doesn’t generalize well. And so that’s the bane of every data scientist life ever is overfitting. And so we do still have to be careful about that in a predictive sense. However, when we’re doing inference, sometimes we have to be a little bit extra careful. An example that I like to give is say you’re a bank and you’re trying to predict if someone is going to default on a loan that you’ve given them. In a predictive sense, if knowing whether that person has a yellow car helps you understand and makes good out of sample predictions for whether that person is going to default on their loan, I don’t care. I don’t care if that’s a real relationship, if that’s causal. I just want to know if this person is going to pay me back or not. Whereas if you’re doing an inferential model, I think we might want to put some more thought into that. We want to do a dag, right, to look at the causal relationships and see if maybe, I don’t know, there’s some confound there between having a yellow car and defaulting on your loan. And so you might want to put a little bit more thought into that.
0:29:53.7 MK: So wait, have I got this right? So in the case where you’re trying to predict, you don’t care about a causal link with the yellow car. Have I got that right?
0:30:03.7 CP: It depends.
0:30:04.4 MK: Because you care about the prediction as the primary thing that’s the most important, the accuracy of the prediction. And then take me through the second piece.
0:30:15.2 CP: Yeah, so in the predictive context, first of all, if having a yellow car doesn’t help me predict values that the model’s never seen before, right. So if the out of sample accuracy is bad, do not want to include it. But if it just is say, tangentially related to a different construct we can’t measure, maybe wealth or eccentricity or something like that that we don’t have a good measure for. But having a yellow car is a proxy for, then if that helps me make a prediction, great. It’s giving me information about something else. Even though having a yellow car itself is not what is making someone default on a loan, well, maybe I don’t know the power that yellow cars have. In an inferential case, what we really care about is, are the relationships that we’re modeling accurate to the real world. For instance, if I have, let’s go the frequentist route, if I have a significant p-value on my regression coefficient for having a yellow car, then is that a real relationship? Is that a causal relationship? And when we say causal, what we really mean is if we change the color of your car, if I got in my Camo garb and re spray painted your car, is that suddenly going to change how likely it is that you’re going to default on your loan payment? That’s what we really care about.
0:31:38.5 CP: And so in that case it does matter that really, I guess if I’m thinking about it deeply, I don’t think the color of your car is causally related. I think there might be some other process like your wealth or how chaotic and wild you like your car colors, that it’s causing both loan default probability and causing you to have a yellow car. In that case, then I might really care. I’m not really truly estimating a causal impact there. And so that insight isn’t going to help me. Right. If I am a bank and I want more people to pay me back, I am not going to then go out and spray paint their cars yellow because that’s not a causal factor in paying back your loan.
0:32:19.8 TW: But that’s, I mean you mentioned kind of a DAG in passing that goes, it goes back to talking to a subject matter expert who may be into the psychology and they, if you were diagramming it out saying why would a yellow car. And they said, oh, that’s actually a… That may be related to flightiness or eccentricity or something. You can capture all of that as sort of assumptions or kind of likely relationships that could then guide. Right, because that could give you like. Well, instead of yellow car, if a yellow car is kind of a proxy for something else, there might be a better proxy. So maybe you should look at that other proxy that we can measure and use that instead which just gets you back to picking parameters while working with a subject matter expert that are the best.
0:33:07.3 CP: Yeah. You can’t build very many good models without a subject matter expert. And I think it really comes down to, are you asking a causal question? And often in the space of marketing, we are. Right. When we want to know the effectiveness of, we keep saying Facebook, there are other marketing channels. But if you want to know the effectiveness of Facebook, what you’re really asking is, if I change my Facebook spend, is that going to have an impact on whatever it is that I’m measuring? And so we really are asking a causal question in a lot of these scenarios. If you just want to know what things are associated, then we might not care. Right. So if you have a model that’s predicting the LTV of a customer, again, it might not matter if you know that they have a yellow car, they’re going to spend huge amounts of money with you. Great. That helps me kind of forecast what my customer LTV is. Plan accordingly for whatever server space or whatever it is you need to serve customers like that. And yet it’s not the case that I might want to go spray paint my customers cars yellow, because that’s not actually going to have an impact. So often in marketing, we are asking these causal questions because we want to be able to take an action and understand what impact that action would have on whatever it is we’re measuring.
0:34:29.9 MK: Okay. Weird question. I feel like I’m always doing this and I’m like. But about the business. I’m just curious. So I feel like I’m with you on the yellow car analogy, which I love, by the way. Although I do want to see you in like, some kind of guard spray painting Tim’s car at some point.
0:34:47.4 CP: Can do.
0:34:50.1 TW: My first car was a yellow 78 Chevy Monza. So, you know. Yeah. And I’ve always never defaulted on a loan, so.
0:34:57.4 CP: Well, there you go. Proof.
0:35:00.7 MK: Okay, so the bit that I… I’m, yeah, obviously much more on the business side. How important is it? Like, those two scenarios make sense to me. One is about getting the best prediction. One is about establishing causality. If I were a stakeholder, though, and they saw a little bit under the hood of this yellow car situation, they probably wouldn’t understand why in case A, it’s important, but in case B, it isn’t. So when… I mean, how much are you showing under the hood? Or how important do you think it is to understand? Tim is pointing out his book being like, Moe, go back and read it for the fifth time.
0:35:40.5 TW: No. Buy it for your… Get it for your business partners. Yeah, no, sorry.
0:35:46.0 CP: I would love Tim’s take on this since he pointed out his book. What do you think?
0:35:52.1 MK: Yeah, Tim, hot seat time.
0:35:55.3 TW: Oh, shit. I just remember we were… And it was Joe Sutherland who kind of made that. Point I think in the book, more about… I think you can have that discussion. Like, what are we really trying to do here? Like, I feel like the way Chelsea, you were framing it do you care if the analyst has a really good understanding of the distinction in that specific case, like with the yellow car? Like, do you care more about just making the best prediction of whether they are going to repay, default on their loan or not? Or are you really trying to understand kind of the relationship as to what’s causing it? And I think in business a lot of times they would say it’s more about prediction than… I mean, I think that’s like that is a fundamental concept that I wish business users could make that distinction. I don’t think we try to educate them. And it’s not that hard to do. Right.
0:37:00.0 JH: And I wonder too if you ask them, is the data point of the prediction, their likelihood to default, going to help you make business decisions, or is the data point that having a yellow car has a causal relationship with you defaulting? Like, which one’s going to help you make a business decision? I would argue it’s the first one. Right.
0:37:20.8 CP: Depends where you are in the business.
0:37:23.0 JH: True. But if I know you have a yellow car I can’t change your yellow car. I mean, I guess you might, treat them differently. You could target yellow car havers.
0:37:32.9 TW: Yeah.
0:37:33.2 JH: Okay. And there you go.
0:37:34.0 MK: That’s why I think in marketing you would be more interested in the causal relationship. In finance, you would care more about the predictive quality because you’re responsible for like a company forecast and you care about accuracy. So even where you are in the business might make a really big difference.
0:37:49.4 JH: That’s a good point. And actually I’m. I have an example that I have. I selfishly want to know if a regression then was a good choice here because I feel like it’s maybe, maybe it’s… I think it’s fitting more in the inference side. But we were working with a hotel chain and they were.
0:38:08.2 TW: By the way, if you’re listening to this and you’re at a hotel chain who worked with Julie, it was the other hotel chain she was working with. This was totally not you.
0:38:16.2 JH: Yeah. Totally. I mean, it was an interesting question. I’m more questioning if I chose the right way to analyze it. So it’s on me. They wanted to know, they had this idea that to help them personalize search results online, that they should be using distance between the person searching and where they wanted to go as like a feature. And so what we started to do was try to say, okay, is there actually because they were trying to obviously increase profit, have people stay places longer spend more with them, whatever. So we broke it down and said, okay, well, let’s start and say, is there even a relationship between distance between where they’re searching and wanting to book and profitability? And we broke down profitability into like three ways to look at it. But we used a regression and we ended up finding that like, sure, it says there’s a relationship that exists, but like, it’s not actually a good, it’s like not impactful. It was like you had the statistical, like p-value was there, but the actual coefficient, like we pretty much were able to tell them that no, these are not great variables to use, possibly as like eventual predictors.
0:39:29.3 JH: And again, it was kind of like a weird one. We worked a lot with some co workers that it was a, it felt sticky. But we were pretty much trying to just say like, does a good relationship exist here? Or not to use this almost as like a feature in a more complex model or prediction.
0:39:45.1 CP: Well, I think the good news is I don’t want to set this up as a dichotomy of like inference and prediction are these two concepts and they’re both worthy goals. They’re not completely separate. Right. We often want to make sure that like we have a good model and that looks the same in both concepts contexts. But in your specific case, you’re actually bringing up a really interesting thing. Are things impactful versus are things statistically significant? And I think that that’s a really important distinction because, for instance, I might be so confident, especially in these kind of big data scenarios, I might be so confident that when someone is further away, let’s say every hundred miles further away they are from their destination, it’s going to increase my profit by a hundredth of a cent. And I’m so sure that’s true. But that might not be something that you want to action on because of the cost of implementing whatever algorithm or whatever promotion or whatever it is that you’re going to do in response to this. It’s just not worth a hundredth of a cent per hundred miles. And so I think that’s a really important distinction because when we are doing statistical inference, one of the methods we can do that with is frequentist statistics.
0:41:01.2 CP: And often what you’re looking at is a p-value which just tells you how confident am I. Well, let me rephrase this to be more specific, a p-value basically tells you how compatible is what we’re observing with a world where this effect truly is zero. So if there really is no effect between the distance that someone is from their destination and whatever profit metric you’re using, how compatible is the data that I observed with that world? And often the answer is going to be not compatible. This would be a ridiculous thing to observe in a world where there is no relationship. And that’s what the p-value really tells you is like how compatible is what I observed with this idea of not having a relationship. But that being said, even if I am pretty certain that my data is incompatible with a world where there’s no relationship, it doesn’t mean that that relationship is like practically significant is often the term people use. And so I think you have to distinguish between that. Now that being said, we’re sort of veering into the territory of using p-values to do variable selection in regression models, which is a little bit iffy and kind of a can of worms to get into.
0:42:12.6 CP: But I do think that that distinction between a statistical test and a practical significance of the result is so important. And it comes up a lot if you’re like A/B testing something and you get a non significant result, oftentimes people just throw those tests away, they’ll say ah, not significant. Can’t use any of the insights here, but that’s the wrong way to think about it because if you think about the way that frequentist testing works, which is often what is reported with these tests, you might have a non significant p-value because the null is true. You are actually living in a world where your A/B test had no effect, whatever variant or intervention you’re testing, no effect. Or it could be that there’s so much uncertainty about the effect that we can’t exclude zero. But there might be some evidence that the effect is positive or negative in either direction. And by itself null hypothesis significance test don’t distinguish between those scenarios. And so it’s one of those cases where it’s super important to not just use what typically is outputted. So a null hypothesis significance test, maybe you pair that with an equivalence test which tells you if something is practically an effect is practically equivalent to zero.
0:43:31.4 CP: Maybe you look at effect sizes to see what that effect is or how precise your measurement is. Are we very certain it’s zero, or are we certain so uncertain it could be zero? Because those are very different things, very different results that you can get from a test.
0:43:46.8 TW: Oh, this is killing me. Because we are not going to get to logistic regression. We’re not going to get to talking more about squares and how OLS is least squares and why is it squares. We’re not going to talk about time and why time is uniquely. And if I stop now, Moe’s going to say, I have one more question and that’s why I left time for Moe. One more question.
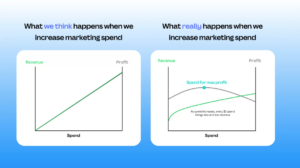
0:44:08.8 MK: I do. I have a really stupid question. And it is something that has been top of mind since we first started speaking. And dear listeners, I promise we will put up a picture of this in the show notes because I can’t talk about it without the picture. And I realize we’re on a podcast, so. Okay, so I’m gonna do my best to explain what we’re looking at. Basically, on the left, we have a line kind of going up, like what you would see in a typical linear regression. As you increase spend, revenue goes up, profit goes up, et cetera. Right. And I feel like I spent so much time looking at this particular graph, and the reason I think this is really important is because I sometimes wonder if people’s familiarity with linear regression means that often we interpret this relationship. You increase spend, revenue increases linearly. And I sometimes get concerned that we’re always trying to untrain this out of our stakeholders. And so the graph that we have on the right shows a diminishing return curve. So basically, for every extra dollar you spend, you have less and less revenue. Right. And I feel like, fundamentally, for a business that uses MMMs, we’re constantly trying to unpick this with our stakeholders.
0:45:32.3 MK: And I’m really curious to get Chelsea’s perspective. Like, we constantly are talking about linear regression. So easy. It’s so simple. It’s great. Everyone should know how to use it. And I feel like I’ve got the opposite problem where I’m like, it’s so common. I feel like I’m trying to get people to unlearn it. And is that a fair observation?
0:45:51.6 CP: Yeah, I mean, I think the problem is that we teach such a fixed set of tools. When people learn something like linear regression, it’s often not taught in a way that would allow them to plug and play some more complex methods on top of it. When really what we should be teaching is those base core concepts of regression that then allow you to plug in. Oh, before we plug in spend into our regression model, we’re going to saturate that spend because you can’t spend a million dollars in 10 minutes and have the last dollar be as effective as the first dollar dollar. But I think that that’s something that’s really important to distinguish because it’s not that regression is wrong here, it’s that we also need something like that saturated spend on top of it that makes it complicated. And because people have learned linear regression in such a fixed way, that results in the graph on the left, which for again, people listening at home is a straight line. No matter how much you spend, every dollar is going to bring you the same same amount of revenue as the previous dollar. Because we’ve taught regression in such a fixed way, people aren’t able to make that generalization that, hey, what if I actually plugged in not spend but saturated spend, that talks about, okay, when I am spending something, I am not necessarily going to get a dollar’s worth of effect from my millionth dollar.
0:47:14.6 CP: Maybe I’ll get $0.01’s worth of effect from my millionth dollar. And so if you think about it in that terms, we can still use the ideas behind linear regression, but it does have that added complexity on top. And because we teach linear regression sort of as this thing that comes out of the box and you can’t really alter it, it’s hard for people to understand that those two things are still incredibly related. And it makes the real world scenario with saturated spend feel much more complicated than it actually has to be. Because when I explain it like that of like our predictor is not just spend, it’s saturated spend, that’s something that can maybe make a little bit more sense. Although the actual complexity of implementing that is a bit more difficult, at least the insight is still really comprehensible. But that’s not what they’re thinking about when they’re thinking about linear regression, which is probably causing a lot of the problems that you’re describing.
0:48:10.3 TW: But if you’re talking to a subject matter expert, I feel like you just described it in a really, really good way how are you going to spend the millionth dollar? Well, you’re gonna be casting your net broader like you targeted initially why… So it feels like, I don’t know, that feels like another one where you’re acknowledging the importance of the marketer being a subject matter expertise and that what they actually know does kind of play into what the analyst or the statistician is doing with the data. Like they can come together. It can be a Kumbaya moment.
0:48:50.1 CP: They should. Yeah, yeah. I’d argue you’re gonna do much better work that way.
0:48:55.9 MK: I guess my thing is I feel like the marketers who are like on the tools get that, right. Because they understand saturation. I think it’s more when you’re trying to explain it to senior leadership that it gets really tricky.
0:49:09.6 CP: Well, you can give them some examples of. I always liked the example of if you have an influencer channel at first, you’re going to be able to scale up really well. You’re going to be able to find influencers that are targeting your niche audience or people who are really likely to align with your brand. But if you keep spending up, you’re eventually going to get to that random influencer who has 100 followers and all they do is review toe socks. Is that going to be an effective spend for you? No. And I think that that’s really important that like you are really limiting yourself. If you wanted to spend a billion dollars in influencer, you’re really not going to be able to scale up in that way. And hopefully that’s an example that makes them both laugh but also go, oh yeah, my last dollar is not going to be effective because I can only find so many influencers that are really aligned with my brand.
0:50:02.5 TW: All right.
0:50:04.3 MK: I’m going to use the toe sock example for sure.
0:50:05.7 JH: Toe socks and yellow cars.
0:50:07.3 CP: Toe socks and yellow cars.
0:50:12.3 TW: It was good. I saved buffer for Moe’s last question. It created chaos that you, dear listeners, did not have to experience because of the magic of editing. With that, we are going to have to wrap and the last thing we like to do is go around and do a last call. Something that each of us found kind of interesting, share worthy, related to the show or not. And Chelsea, you are our guest. Would you like to go first with the last call?
0:50:42.2 CP: I really would. You said this didn’t have to align perfectly, but I did want to choose a recommendation that I think listeners who would enjoy this episode could also use. So I actually want to recommend a YouTube channel. I hope I’m pronouncing this correctly because I’ve never heard them say it on the YouTube channel, but it’s ritvikmath. And it is an excellent resource for data, science and statistics. If you’re just starting out or even if you’re a little bit more advanced is a way to get really intuitive simple explanations of data science concepts. I’ve definitely used this as a resource when I was a professor and honestly I still use it now as a resource when my job is explaining statistical models to people who are not building statistical models every day. So highly recommend I will maybe link some of my favorites for you to put in the show notes.
0:51:30.9 TW: That would be awesome. Wow. More fun videos to watch. So we know what Michael that’s where Michael Helbling’s gonna go to the video guy that he is. All right, Moe, what about you? What’s your last call?
0:51:46.1 MK: I have a twofer, but one’s kind of cheating a little bit. Firstly, I do want to do a shout out to the Recast blog. It is absolutely phenomenal. There was a recent post that I just saw that is hitting very close to home and there’s a lot of learnings about like MMMs, incrementality, all that sort of stuff that I just find are written so simply and normally using very similar ways of explaining things that I probably would adopt so but probably more eloquent and refined and available for you in a blog. So definitely check it out at getrecast.com. My second one is I am in the midst of our performance cycle where we do like all our performance reviews and growth and impact goals and role changes and all that sort of stuff. And unsurprisingly I’ve been using a lot of AI, but also I wrote a prompt to look for bias and feedback, which led me down a complete rabbit hole. And then I found this article that was really interesting which was called Unfair but Valid Feedback. The seeming contradiction and the thing I really took away from it is sometimes feedback feels really unfair or potentially biased, but it could still be valid too.
0:53:04.2 MK: And so like how do you take away the valid component while potentially challenging, like the bias or the way it was delivered or something like that. So I just, yeah, I found that one super, super interesting and made me think really differently about the feedback that is being shared very widely with both myself and across the team.
0:53:24.1 TW: Very cool.
0:53:24.7 MK: So yeah, those are mine.
0:53:25.6 TW: Nice. Julie, what about you?
0:53:28.3 CP: Totally different spectrums.
0:53:31.1 JH: Well, mine is going to take us for another turn, a hard turn here. But we were talking about our pets with fun names at the beginning of the episode. And I had recently read that an animal microchip company, Save this Life, abruptly shut down recently and there could be tens of thousands, hundreds of thousands of pets that use these Chips and they just aren’t a business anymore. And why I kind of chose this one was one, the pet component, but two we recently have talked about on episodes too, like what happens when a company gets bought and what happens to their whole database. Well, in this case, what happens when a company shuts down and they have a whole database of data people are expecting to be able to use if they lose their pet, whatever. So I wanted to call that out more as a PSA to everyone who loves their pet and might have them chipped. You can get it checked. They included that chips starting with 991 or 900164 are from Save this Life and you can actually reregister them. And there are lots of other companies you can re register with.
0:54:35.5 JH: And they even included that only 6 in 10 microchips are actually registered. So I guess overall, maybe just check that that chip is registered so you can find your beloved pet if you ever need to.
0:54:47.2 TW: Going hard on PSA.
0:54:49.6 MK: What a fuzzy way to fit.
0:54:52.3 JH: Tim, what about you?
0:54:53.5 TW: Well, just because I think it was before we might have been recording it maybe in the outtakes. So there’s stories behind everybody’s pets names, but Chelsea, what is your dog’s name?
0:55:05.1 CP: My dog’s name is Nova, which is short for Anova, or An Analysis of Variance. She’s named after that because I got my start in psychology statistics where ANOVAs are really big. So a little nod to my past.
0:55:19.1 TW: Yeah. So additional cred. If the content from the episode wasn’t already like, wow, she knows her stuff. She’s got a dog named Nova. So my last call is a blog post by our long time friend of the show, Matt Gershoff, called Adjusted Power Multi Arm Bandit. And what I really liked about it is that it’s literally just working with like, a basic understanding of power and confidence in looking at test results and how to think about test design under different scenarios, which anybody who’s dealt with Matt Gershoff much is sometimes left very, very confused. And I almost followed it all the way through, but I liked it just because it was like, if you think about what you’re really trying to do, even if you’ve got 10 variations that you’re trying to test, that doesn’t mean you definitionally need some crazy sample size if you’re really clear on what problem you’re trying to solve. So maybe that even gets to our inference/prediction discussion earlier. So it was a good, fun read. So with that, Chelsea, thanks so much for coming back on. I don’t know how long we’ll have to wait to ask you to come do a part two on regression or hit one of the other I mean, ANOVA could be the next next one up.
0:56:45.8 CP: It’s basically regression. We’ve essentially covered it.
0:56:52.1 TW: Wow. Okay. Boom. We got a twofer. So you your activity on the socials, where are you hanging out the most these days?
0:57:02.2 CP: I am hanging out mostly still on Twitter and also Bluesky, which I’m not gonna lie in my head, is pronounced blue ski. So I was really scared I was gonna say that out loud. So I’m there. You can also find me on TikTok, though I don’t post a lot. Anytime you search for @Chelseaparlett, I should probably come up. But yeah, I think those are the two places that I post the most. And you’ll get the most meme for your energy in those places.
0:57:29.4 TW: I’m finding out how little I am on Twitter now and that I have had the longest, slowest direct messaging going back and forth with Evan LaPointe like, like two weeks. Because I’m like, oh, shit, I’m really not checking Twitter. But I am, I feel like I’m almost fully converted to Bluesky. Skeeting on the Bluesky.
0:57:50.6 CP: Don’t reinforce that it’s gonna come out one day.
0:57:55.7 TW: So no show would be complete without thanking Josh Crowhurst. We’ve. We’ve not given him too, too much special work to do on this episode, but there’s a couple special little challenges for him on this one. We love to hear from our listeners so you can find us on LinkedIn, the Measure Slack. We would love a review on whatever podcast platform you listen to us on. If you want to reach out and tell us what you thought of this. Our first attempt at hitting a statistical method, if you were one of the listeners who requested that or if you weren’t but thought, hey, that was a terrible idea. I mean, that was a great idea. Would love to hear what you think. So regardless of whether you are regressing logistically or linearly or whether you’re inferencing or predicting, no matter what you’re doing for Moe and Julie, I know they join me in saying you should keep analyzing.
0:59:02.5 Announcer: Thanks for listening. Let’s keep the conversation going with your comments, suggestions and questions on Twitter at @AnalyticsHour on the web at AnalyticsHour.io, our LinkedIn group and the Measure Chat Slack group. Music for the podcast by Josh Crowhurst.
0:59:13.1 Charles Barkley: So smart guys wanted to fit in, so they made up a term called analytics. Analytics don’t work.
0:59:19.8 Michael Wilbon: Do the analytics say, go for it, no matter who’s going for it. So if you and I were on the field, the analytics say, go for it. It’s the stupidest, laziest, lamest thing I’ve ever heard for reasoning in competition.
0:59:34.7 TW: And then there are people who just have hot sauce. They give me another dog after.
0:59:38.9 MK: Yep, yep, we have a Cholula.
0:59:40.9 JH: Yeah, Good hot sauce. Great.
0:59:42.7 CP: I remember Moe’s dog’s name. I can.
0:59:44.5 JH: My dog had. My dog had her name when I got her, but I decided to reach change the spelling. So that was Kaylee from Firefly instead of Kaylee. That’s a very obscure TV show.
0:59:57.4 TW: That’s some other nerd. That’s some nerd tread.
1:00:00.0 JH: That is literally the only nerdy thing I ever have been able to say ever. Ever. That is so not normally my thing that I could just throw in there. But anyway, I was going through a five minute.
1:00:16.2 TW: Oh, I got two or three ways I want to go with this. So unless foul or foul, literally the person who’s not here.
1:00:31.5 MK: Wow, you spend way too much time with that lady.
1:00:41.1 TW: Yep, I do. I should not have rolled off a LinkedIn Live earlier today onto a podcast. Okay, so, yeah, like I said, we’ll stop.
1:01:00.5 JH: Rock flag. And significant doesn’t mean impactful.